Operations
Reverse logistics consumer electronics
Process design, internal tooling, systems
Feb 25’ - Jul 26’
Nobody could tell me how long anything took.
That was the first problem, and nearly every problem after it turned out to be a version of the same one.
What is our return rate?
How much did we process yesterday?
Has this unit been tested?
How many 3DSs do we own?
How long has this been sitting here?
Did this purchase make money?
Are we making money?
The information existed, scattered across people’s memory and free text spreadsheet fields, and there was no way to assemble it into a number you could act on.
Measurement first
I started with a stopwatch.
I went department to department and timed things. How long to receive a box. How long to test a console, clean one, box one. I wrote all of it down. It was the least sophisticated thing I did and everything else rests on it.
Then I wrote the procedures down too: a step by step for every action in the warehouse, with the expected duration attached. Once you know what a job is supposed to take, you can finally tell when it isn’t.
A stopwatch only scales so far. To capture the same thing continuously I built out tester and cleaner workstations: three different designs, all three put in front of real users, and we kept the one that survived contact. That turned cleaning and testing from a black box into a place where production could actually be counted, and it is where most of the numbers further down this page come from.
Month end P&Ls were taking days, built by hand matching marketplace exports against an internal sheet one line at a time. I did it manually across five months to understand its shape before rebuilding it with lookups and macros. Return rate got the same treatment. Nobody knew what ours actually was, so I pulled every report the marketplace would give us and compiled them until there was a true per account number.
Evaluating what we bought
I ran the implementation of a professional inventory system across the warehouse, and it came with a standing Friday meeting with its founder.
That access was the real value. Talking to the person who designed it, I could separate the concepts that are fundamental to inventory management from the ones specific to how his customers worked. Two were fundamental: process batching, and giving a physical object a status you can query. Both went into what I built next. The rest was built for a different kind of business than ours, which was just as useful to learn.
The catalog
This is the least interesting looking thing here and the most important.
The old system stored a product name as free text, whatever somebody typed. Which meant you could export every unit in the building, open the file, and still not answer how many 3DSs do we have, because they’d been named a hundred different ways and nothing grouped.
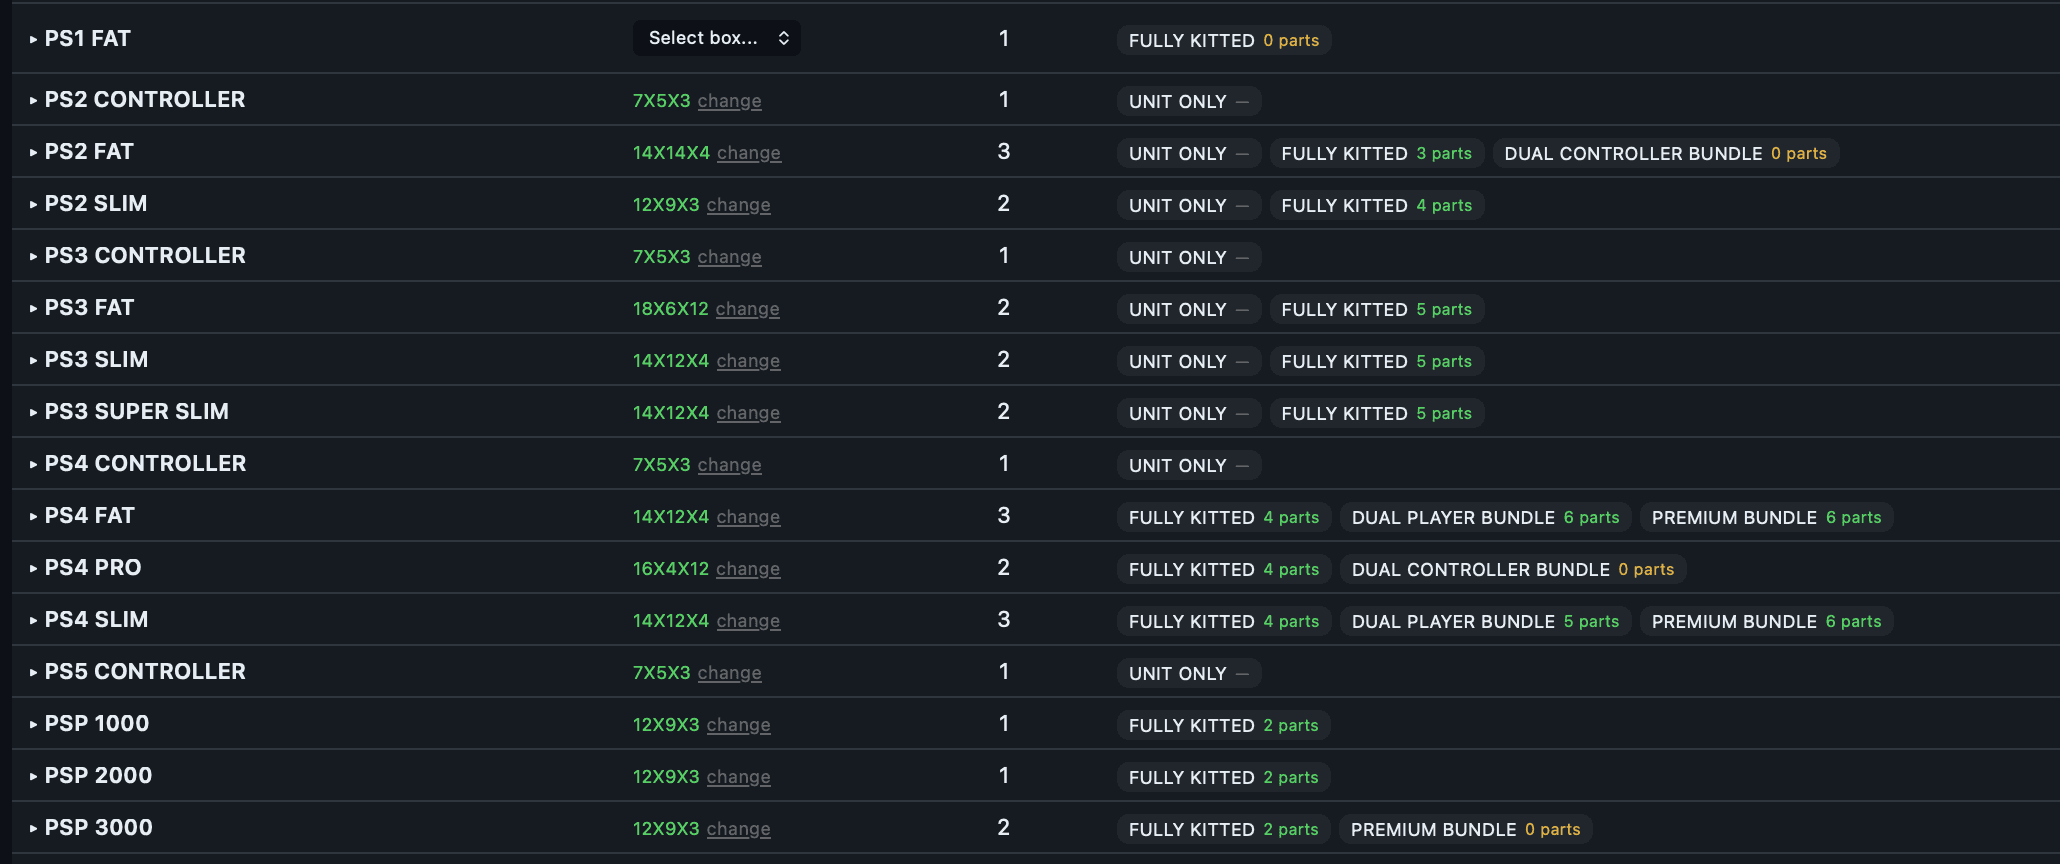
I rewired the whole catalog into a fixed hierarchy: manufacturer, model, spec, capacity, variant. 681 variations across 282 models and 24 brands, structured, filterable, countable.
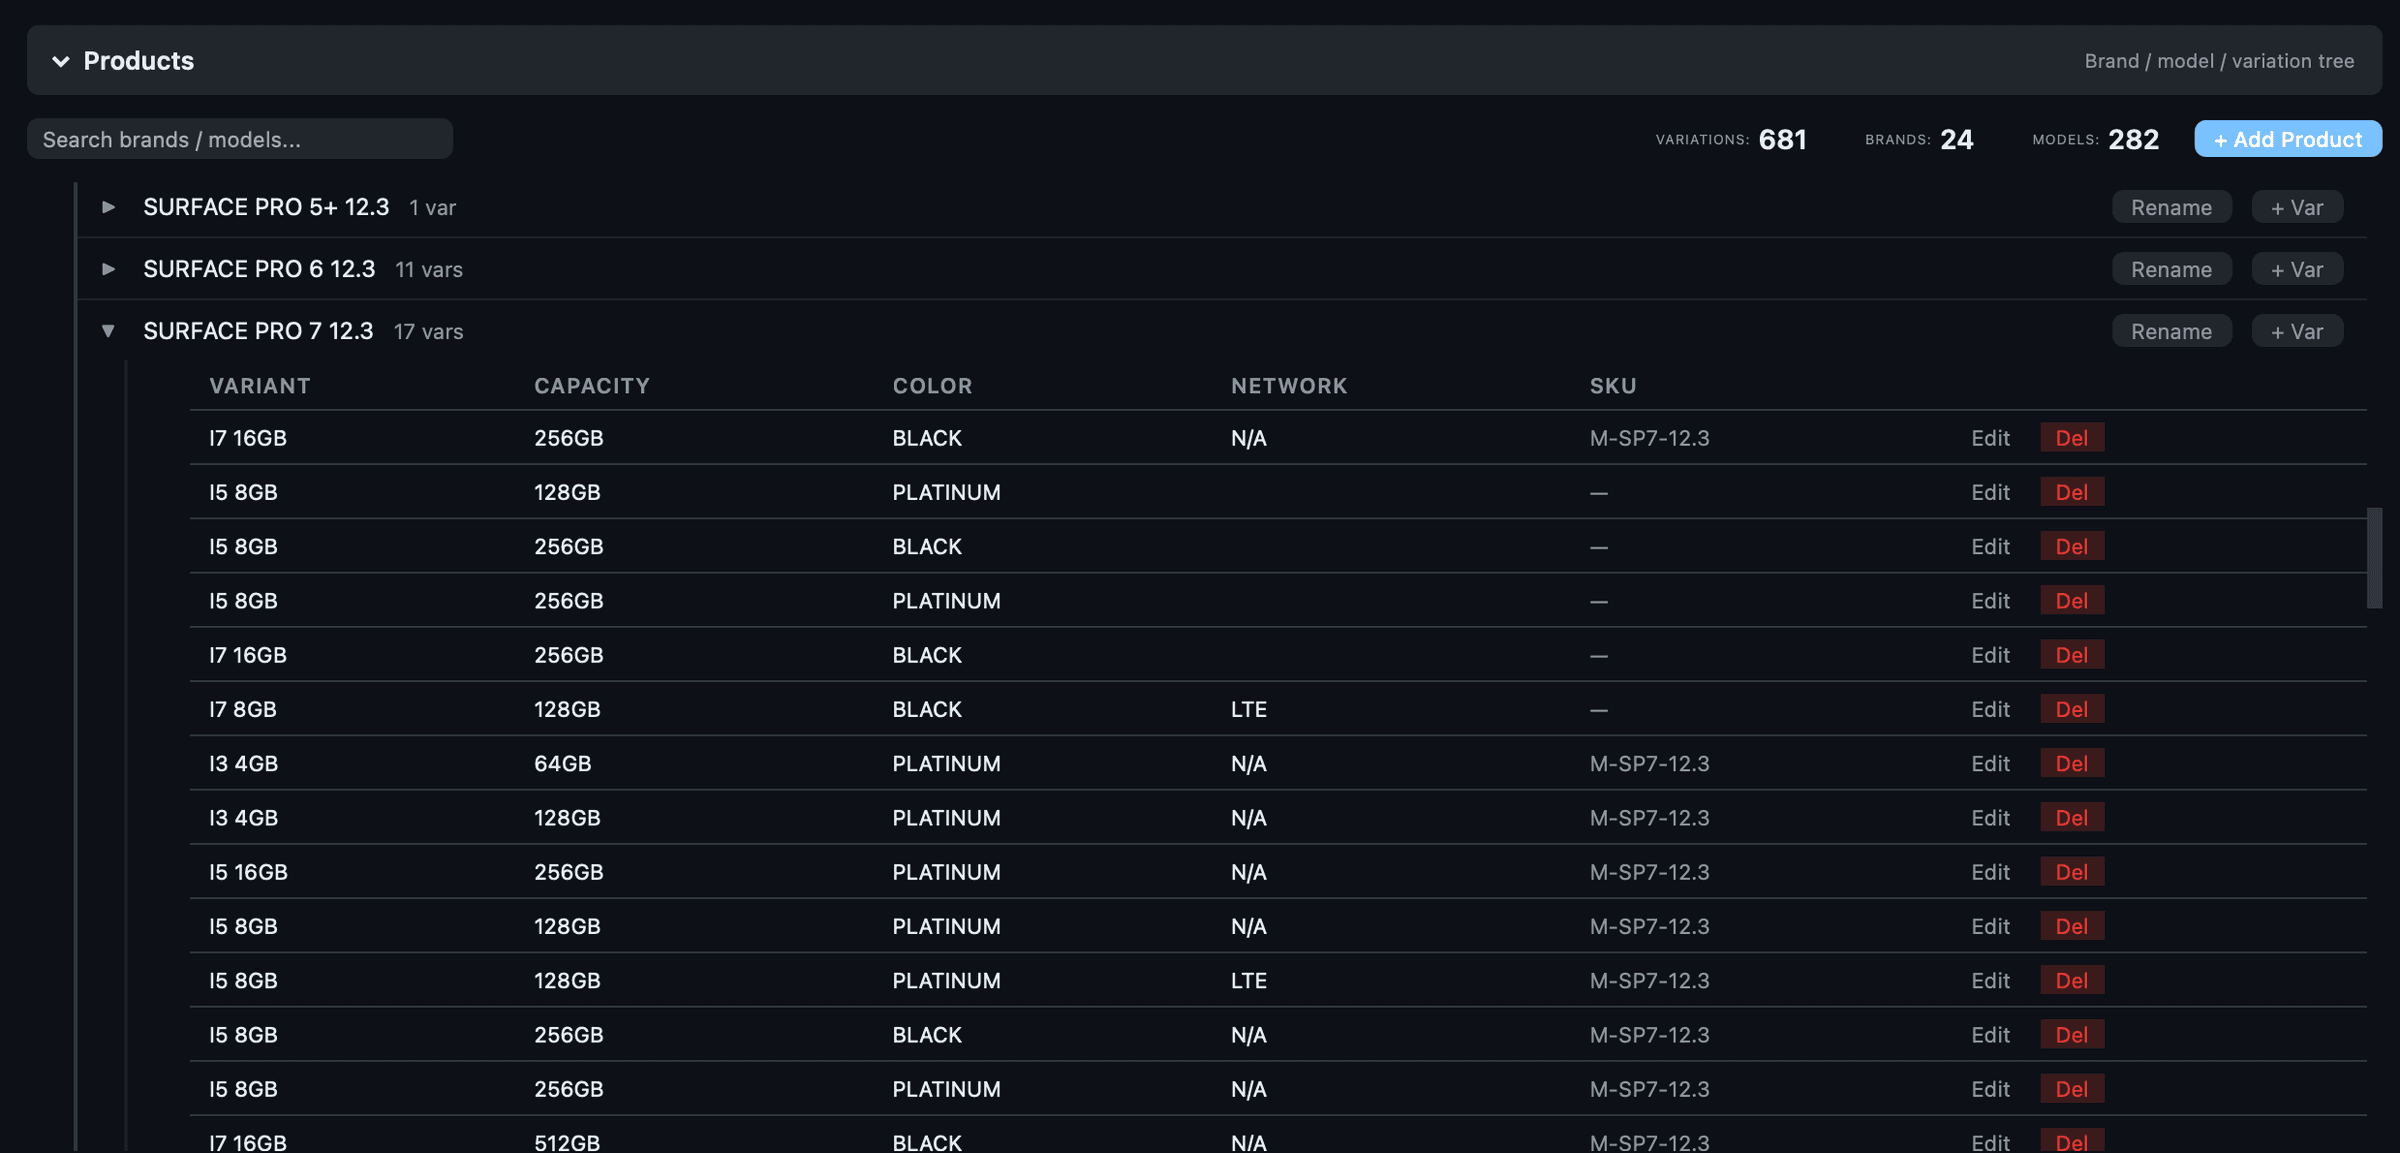
Then the same schema went onto the physical label, so the shelf and the database say the same thing.

Purchasing
Purchasing was invisible. The warehouse found out what had been bought when a receiver opened the box.
And profitability was reconstructed backwards. At month end you took an export of what had been purchased, matched every unit to a listing and a sale price by hand, and derived whether it had made money. Slow, inaccurate, and you had to redo the whole thing every time you wanted to know anything.
The reframe was simple: capture profitability at the moment of purchase and store it forever. Every purchase record now carries the margin that was calculated when the decision was actually made. A number that had only ever been reactive became permanent.
Then I connected it straight to the marketplace we bought from. You search a product and every live listing comes back already scored: the comparison price, the fee math, estimated profit, and a badge telling you whether it loses money or clears 12%, 20%, 30%. One click turns it into a purchase order.
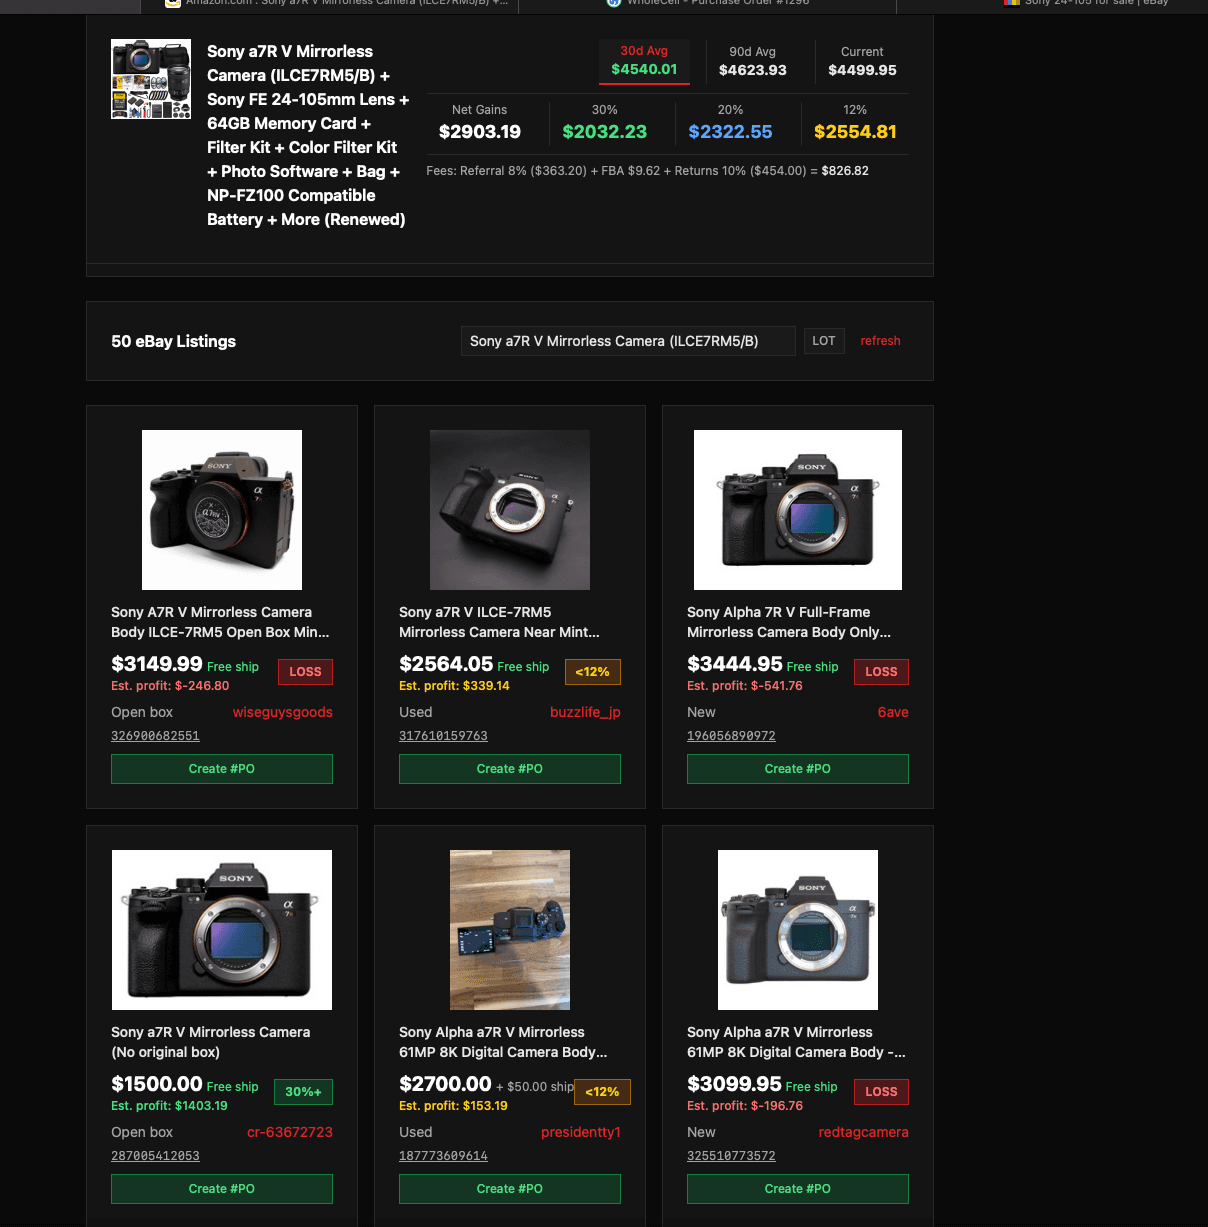
To find out whether the tool was really doing the thinking, I ran an experiment. I took someone from the cleaning department, with no purchasing background and no math background, sat her at a desk next to me, and had her buy product. She was good at it almost immediately.
Once purchase records were permanent I could start projecting forward instead of explaining backwards: what sales should look like given what we actually bought. The first projections were wrong, because time in house and fulfillment method skew everything, so I mapped buy box rate and in house production per vendor to tighten them.
One of those projections turned into an argument. A lot of value was tied up in a slow moving category, so I laid out the margin we would have to give up to keep it moving and flagged it hard. The flag wasn’t given much weight at the time. Six months later the product was still sitting there.
The production system
The inventory software taught us what good structure looks like, but it couldn’t cover the specific things our floor did. So I built the production system.
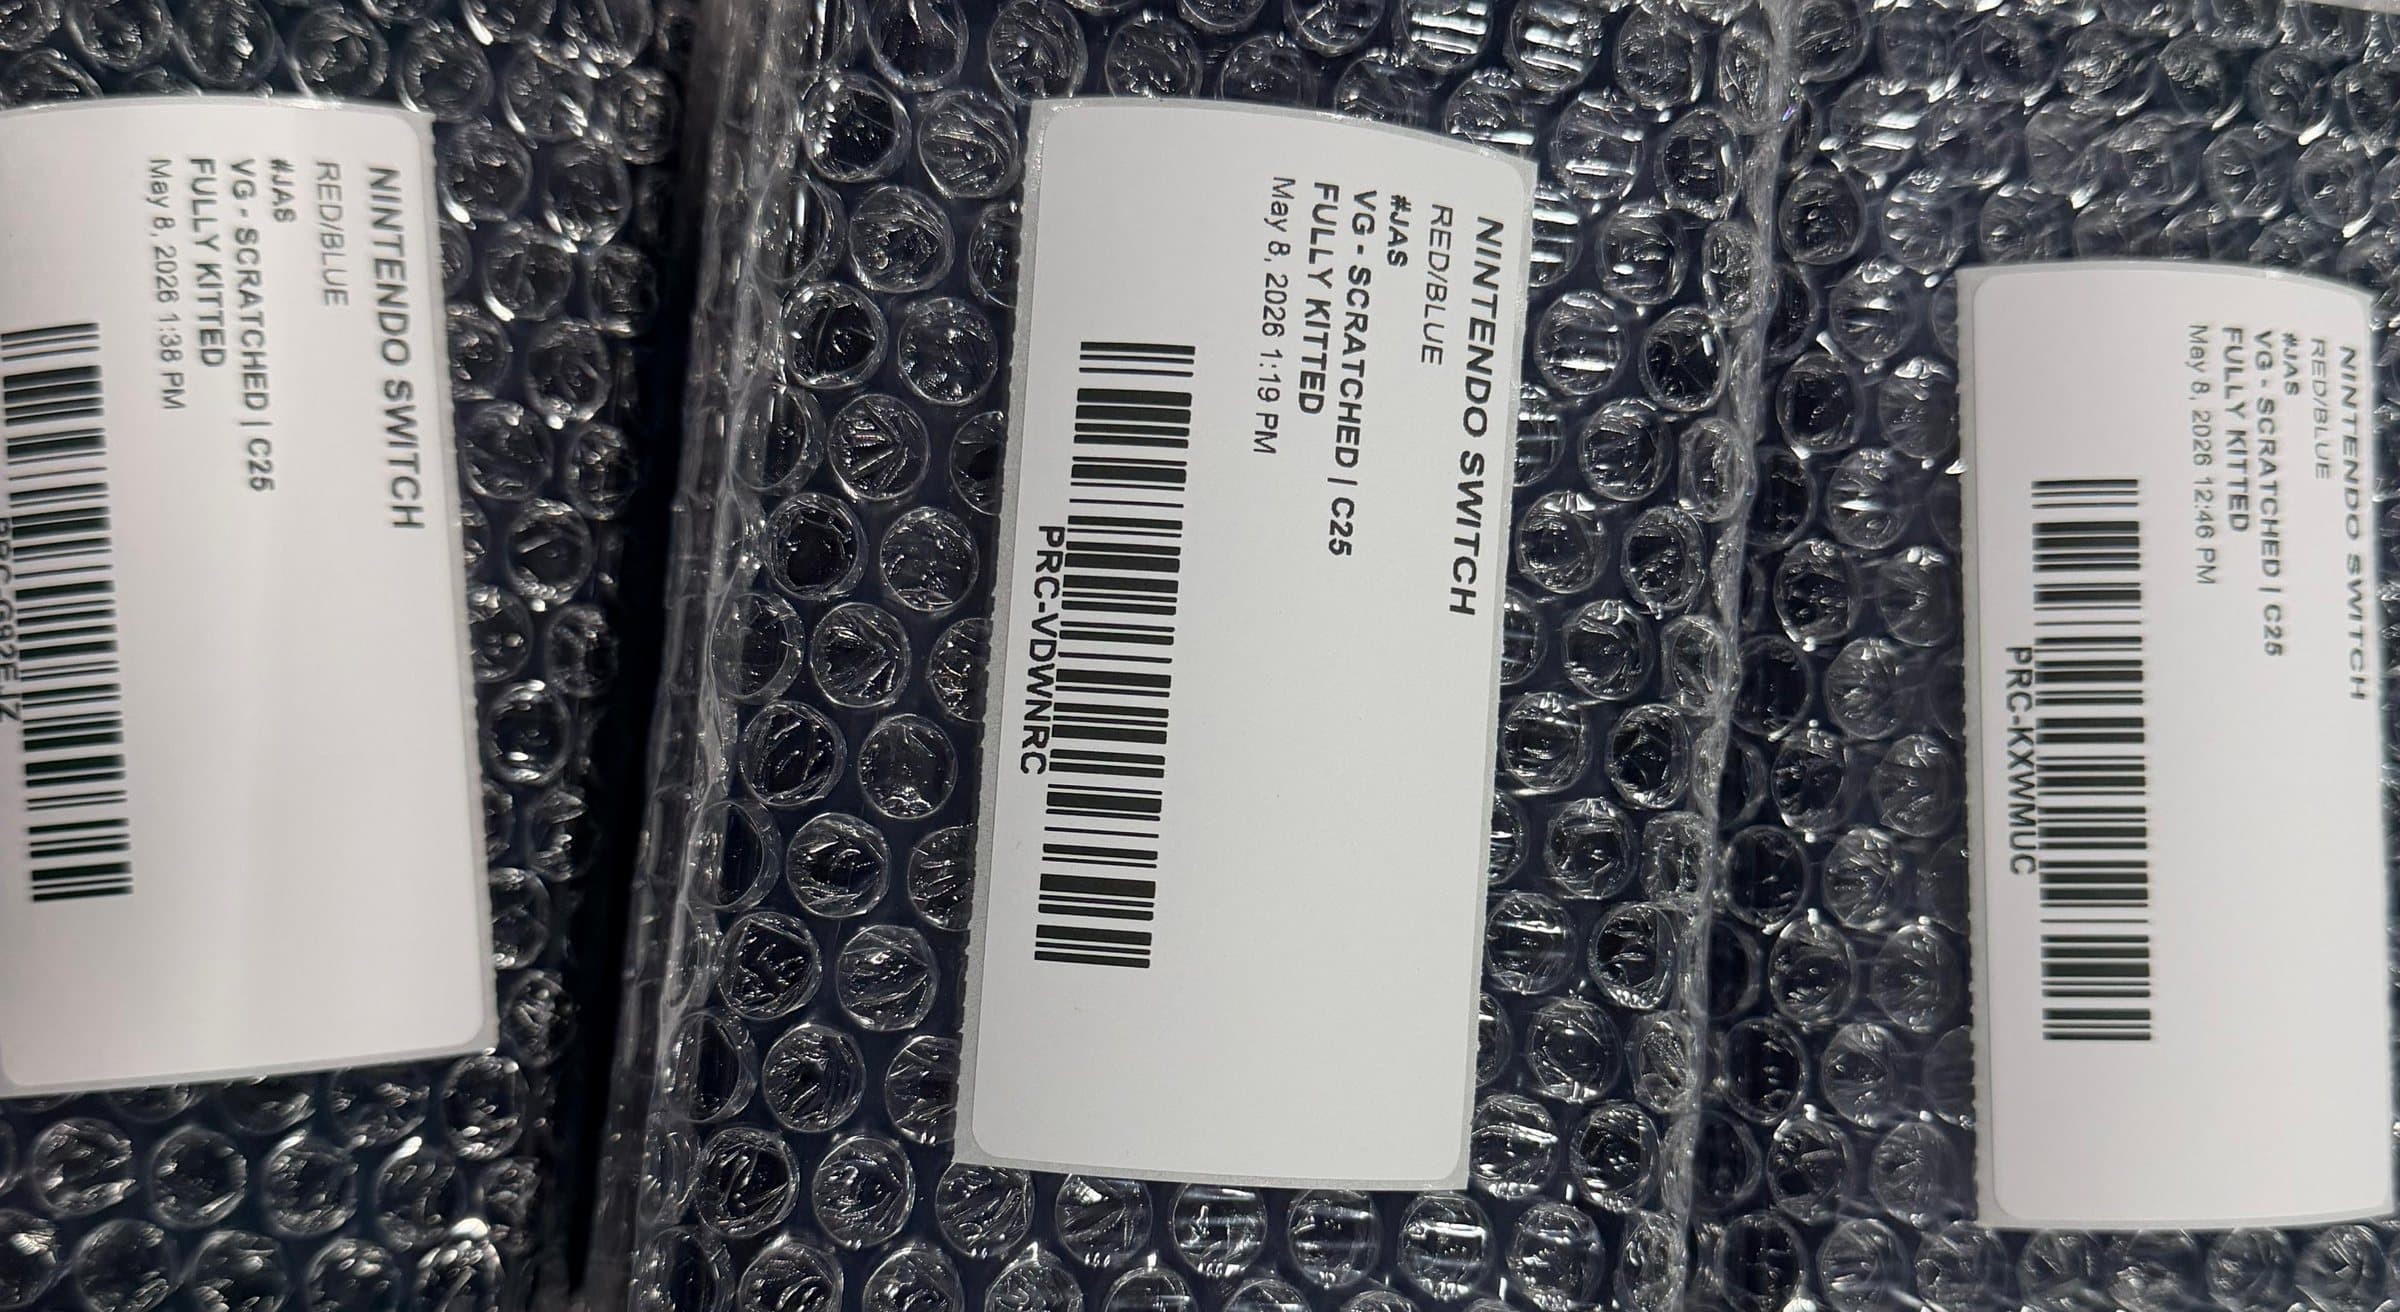
Every department got an interface at the workstation and a label printer next to it. The printers were their own small project, since the ones we had were slow and software locked. I sourced unlocked thermal units for receiving and they became the standard across the warehouse. Any time somebody touches a unit and changes its state, a new label prints describing that new state: vendor, condition, kit, stage, station, timestamp. The unit carries its own history on its face.
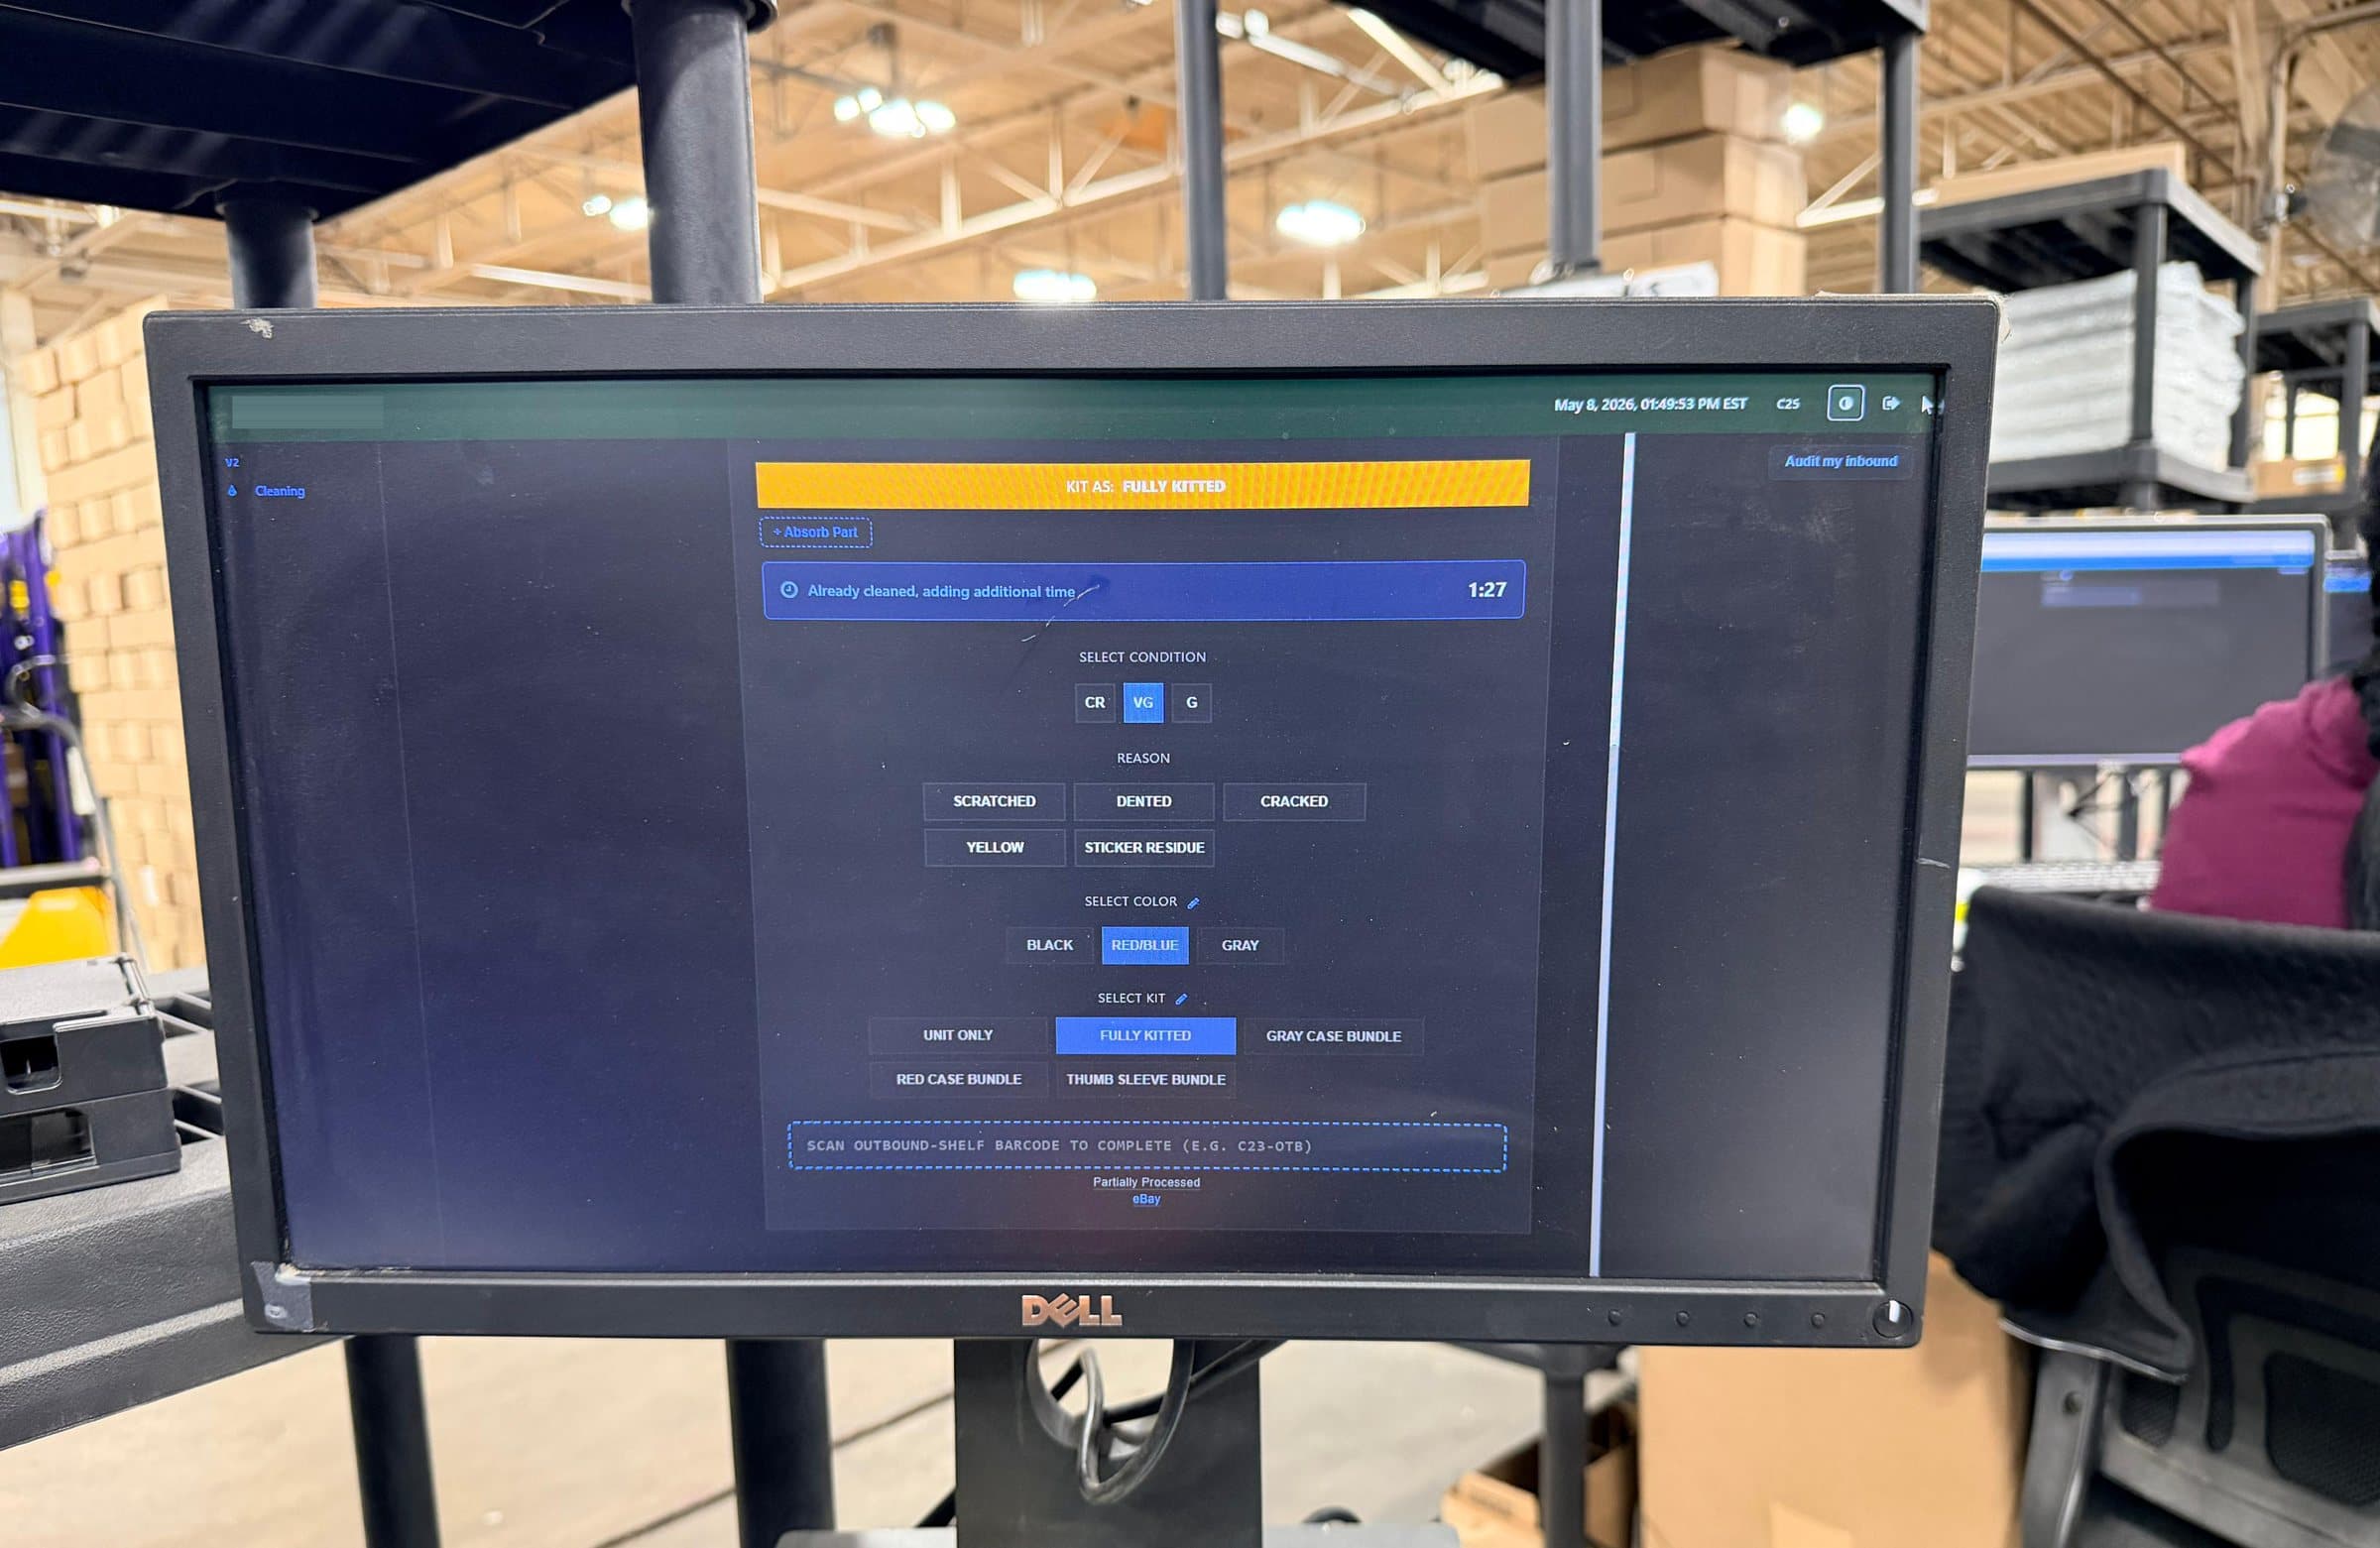
Shipping stopped opening boxes. Cleaning is the last stage where attributes get assigned, so by the time a unit reaches staging everything about it is known. Staging rules govern what can share a cart (no mixing conditions, no mixing product classes), so shipping can trust the cart instead of verifying it by hand.
Condition grading became auditable. Grading is a judgment call and it was a gray area, so selecting the higher grades now forces a photo upload. A manager reviews them through the day, and shipping can pull up the same photo instead of opening the box.
Counting changed. Taking inventory used to mean telling everyone to stop and count everything in the building. Every user has a scanner now, so every user audits their own area.
Three positions stopped existing.
Label printing. One person in cleaning printed everyone’s labels. Every station prints its own now.
Specialty product. Lenses, cameras and special edition controllers used to need specific knowledgeable people. The software walks anyone through the category specific options.
Liquidation routing. Somebody used to walk the floor deciding which product should be sold elsewhere. The system routes it, because a unit that doesn’t fit the kitting catalog is liquidated by definition.
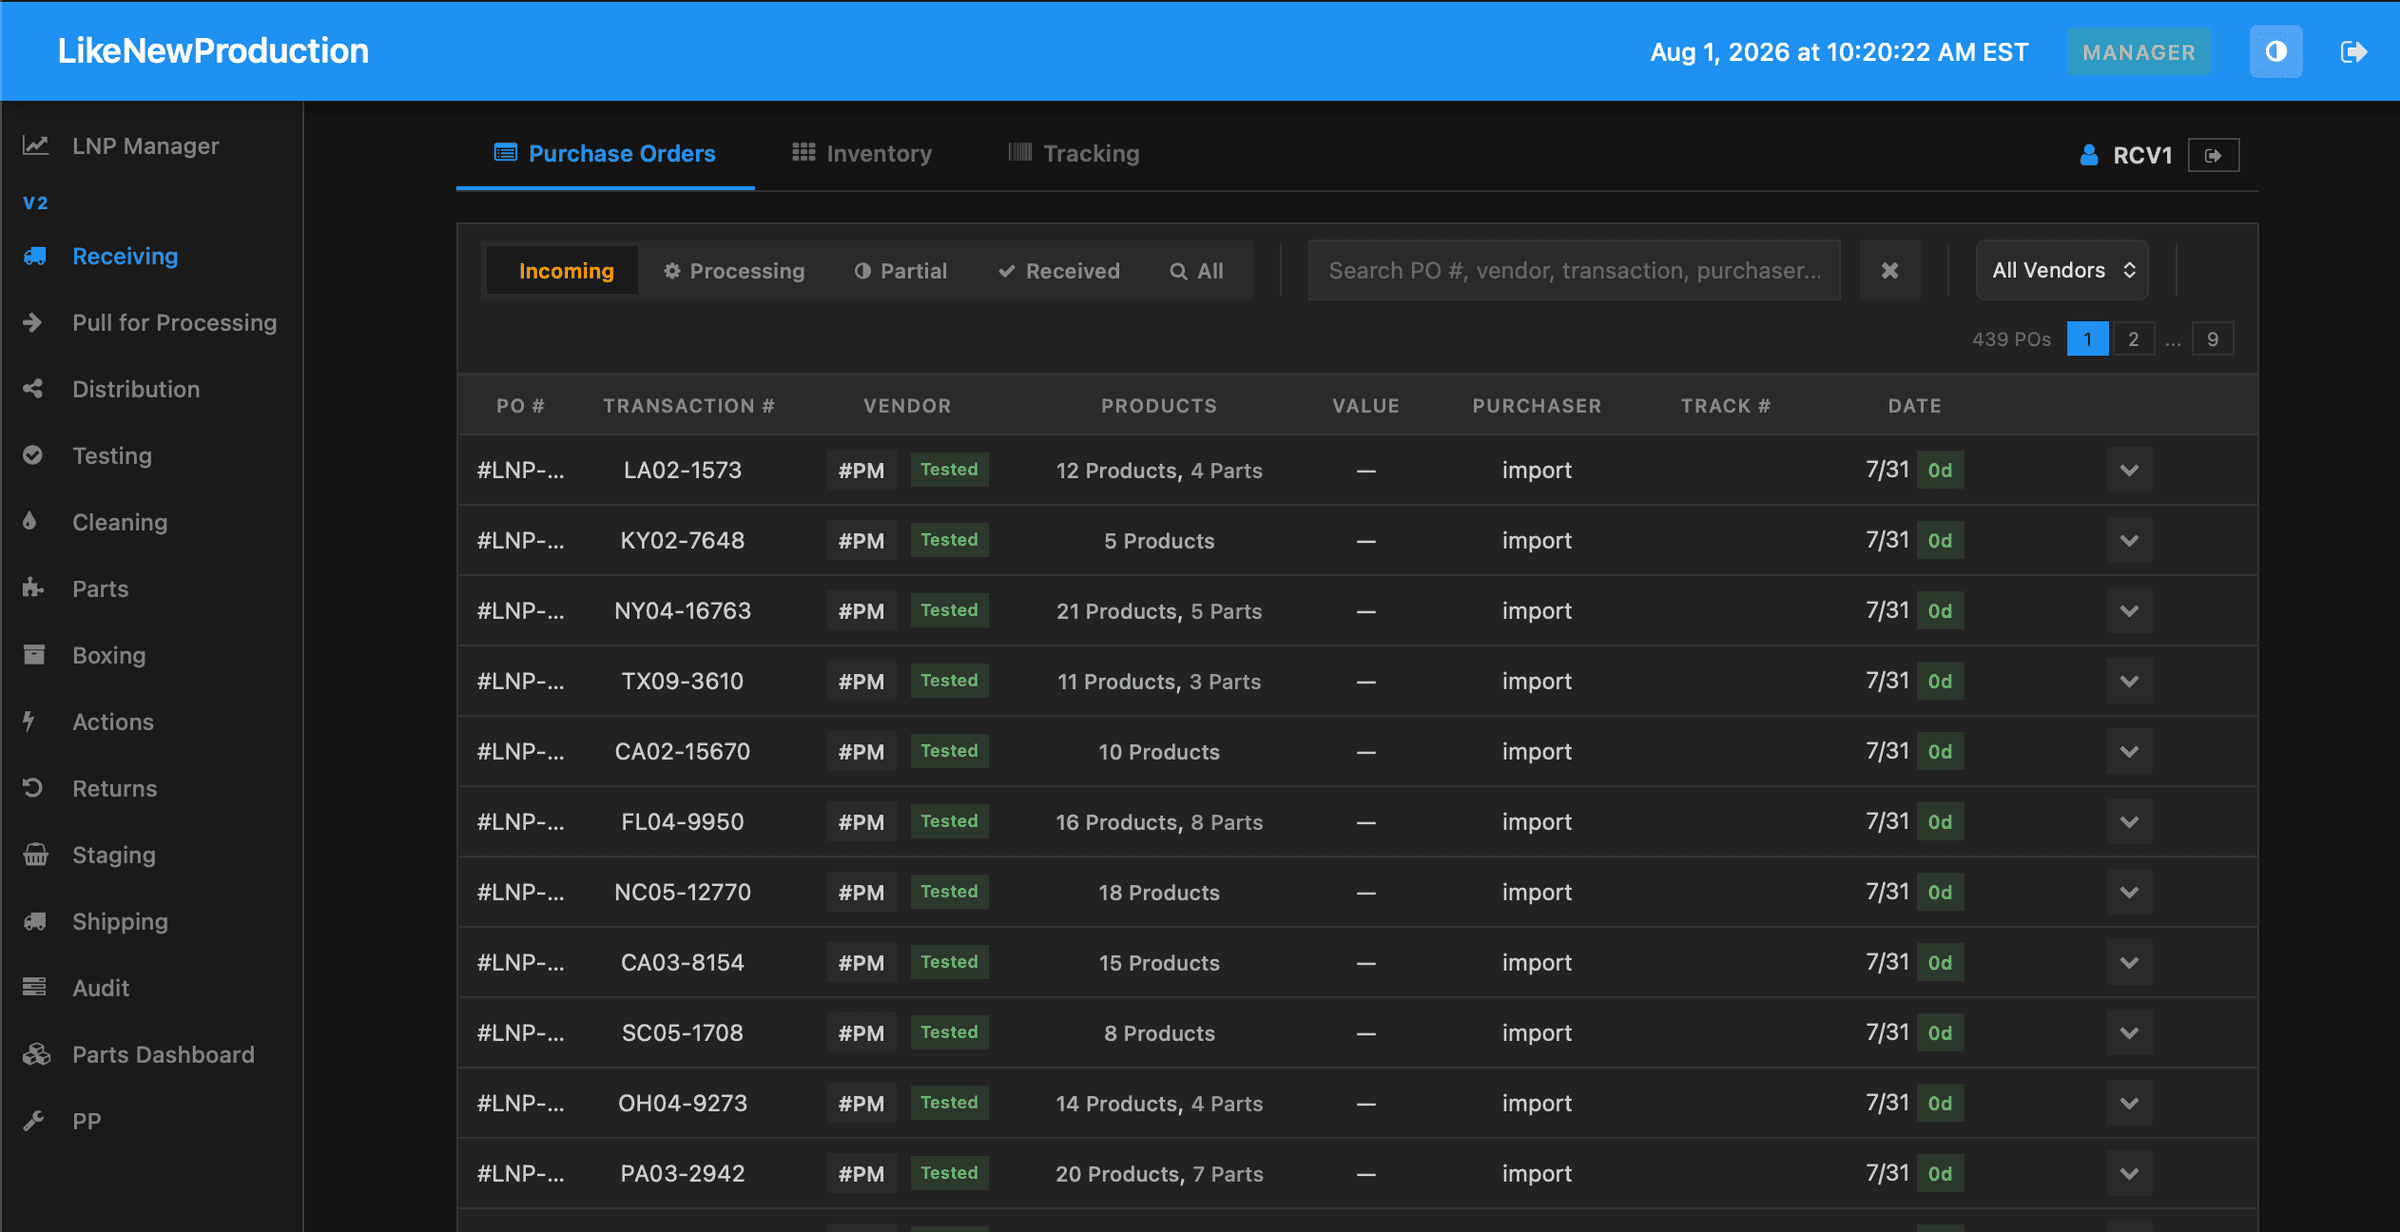
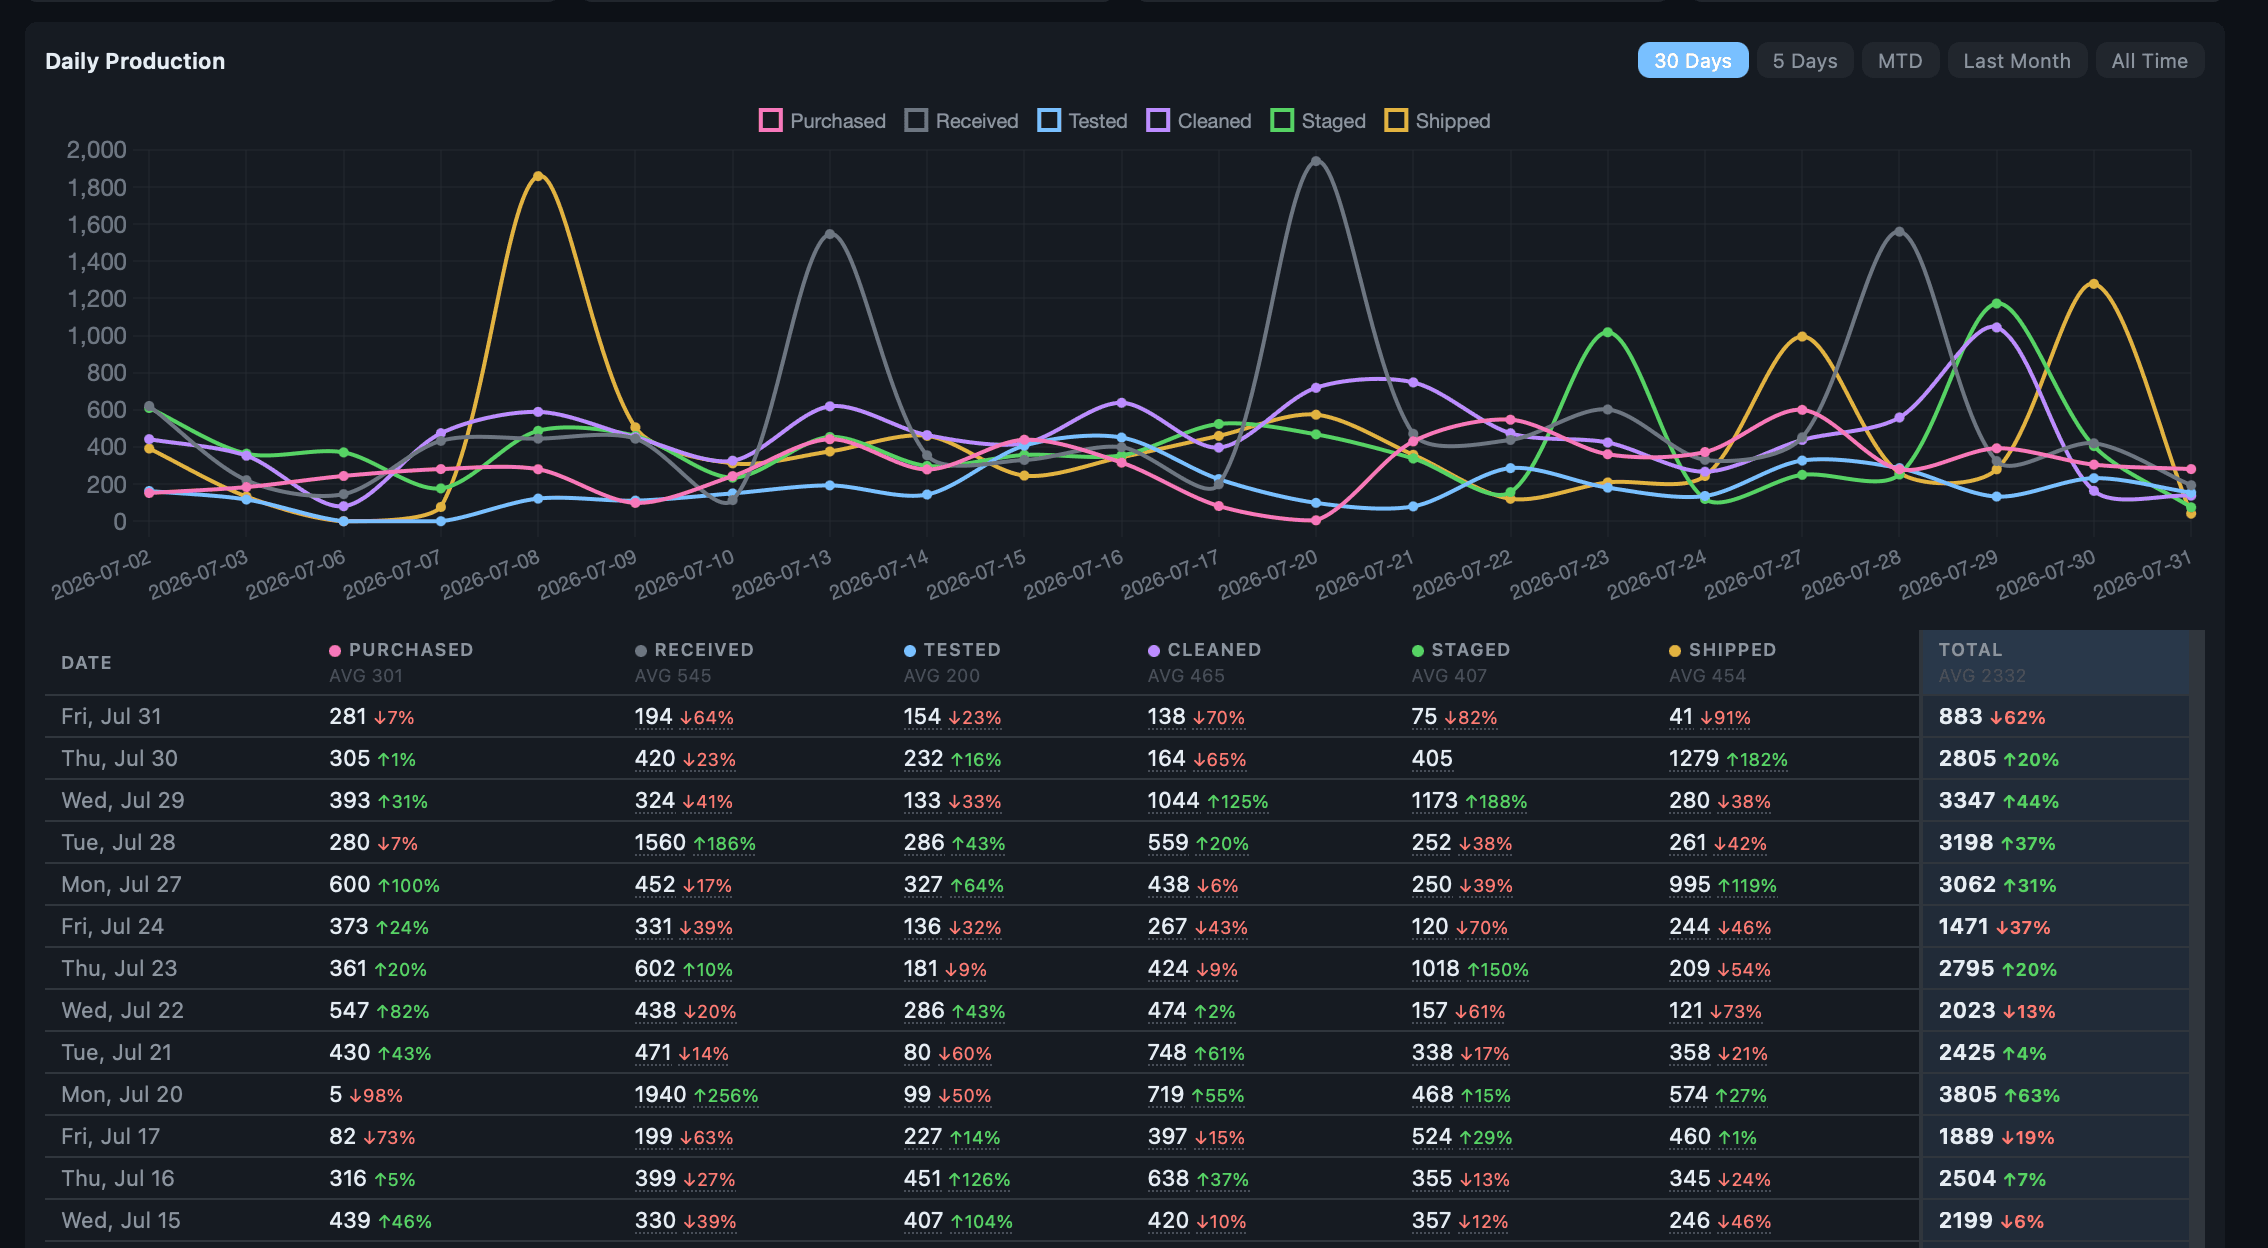
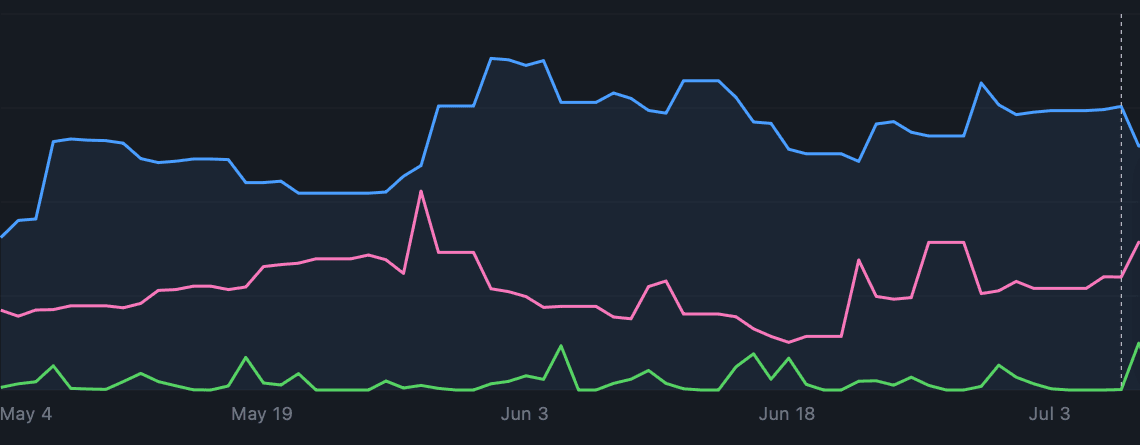
The same records drive value over time, so the shape of the pipeline is visible as a curve rather than as a monthly reconstruction.
In closing
This was mostly noticing that a question couldn’t be answered and then refusing to accept that, over and over, for seventeen months.
Every one of them ended in the same place: knowledge that used to live in one person’s head became something the building could answer on its own.
| # | Problem | What I did |
|---|---|---|
| 1 | No idea how long any process was meant to take | Went department to department timing every warehouse process and logging the results. The foundation for everything after it. |
| 2 | Company P&Ls slow to construct | Rebuilt the process with lookups and macros. |
| 3 | Nobody knew how to use the inventory software | Wrote a full walkthrough plus an operating procedure for every process in the warehouse, step by step, with the expected time attached to each. |
| 4 | Product skins never on hand | Scoped what it would take to print and cut skins in house. Tested the existing machine (poor), then sourced a Roland plot cutter off Craigslist and collected the cut templates. |
| 5 | Return rate unclear | Pulled and compiled every report the marketplace would give us until there was a true, per account return rate. |
| 6 | Month end P&Ls | Developed the method for matching marketplace reports against internal records to get net gain per product sold. Ran it by hand across a five month range first. |
| 7 | Repricing underused | Learned the repricer, worked it into the daily process, focused on min/max price relative to our own purchase prices. |
| 8 | Repricing too time consuming | Structured repricing categories so listings move in and out by status instead of being handled one at a time. |
| 9 | No visibility into cleaning and testing durations | Designed and deployed tester and cleaner workstations so production could be tracked at scale. |
| 10 | Workstation design unproven | Built three different workstation styles, tested all three with real users, kept the one that was most durable and usable. |
| 11 | How much did we process today? This week? | Drafted reports for each, and could run the numbers on demand. When someone asked whether production was up or down, there was an actual figure. |
| 12 | Production reporting too time consuming | Wrote scripts to generate and send the reports automatically. |
| 13 | Replenishment inconsistent | Calculated a per account replenishment schedule from current stock levels and sales volume. |
| 14 | Cleaning throughput | Investigated restructuring the cleaning department as an assembly line, with rows of users passing product backward. |
| 15 | Sourcing research too slow | Automated the pricing connection so every product in the catalog was priced daily instead of looked up by hand. |
| 16 | Product dirt and residue hard to remove | Found a dry ice blasting specialist in New Jersey, brought him several filthy consoles, tested different methods. Extremely effective. The startup cost and operational shift didn't outweigh the department's bigger problems at the time. Worth revisiting. |
| 17 | Cleaners scrubbing with toothbrushes | Tested handheld drills with brush attachments. Also extremely effective. Most cleaners disliked them: you had to stand to apply pressure, and holding the trigger made hands sore. Worth revisiting. |
| 18 | Scratched discs unsellable | Investigated a disc resurfacing machine. 50% pass rate, which isn't worth it on its own, though the economics change if the discs are bought cheaply enough. |
| 19 | Inventory management problematic | Scoped and ran the implementation of a professional inventory system, with weekly meetings with its founder. |
| 20 | Old stock blocking the migration | Built a flush system. Product that predated the migration was stamped with a blue circle sticker so it was identifiable on sight. |
| 21 | Product catalog messy | Rewired the entire catalog into a fixed manufacturer / model / spec / capacity / variant hierarchy. The critical backbone: the old system stored names as free text, so you could never group or filter what you owned. |
| 22 | Learning how software actually gets built | Took notes in every weekly meeting and used them to bring what was good about a professional system into our own, most importantly process batching and product statuses. |
| 23 | Can't tell if product on receiving shelves is tested | Used product status so receivers could take product in as tested or untested, and printed that status in plain text on the physical label. |
| 24 | Labels too small to scan or carry information | Scaled labels to a 4x2 format that fits full product information including tested/untested state. |
| 25 | Inventory software not encompassing enough | Began a sidecar interface for each department to control its own part of production. Never fully adopted, superseded by the production system. |
| 26 | Handheld scanners sluggish and locked | Developed a protocol to hard reset the organization locks and disable the services clogging their memory, making them usable for real work on the floor. |
| 27 | Product locations not granular enough | Gave testing and cleaning clear inbound and outbound locations, so product could be digitally assigned to a specific cleaner's shelf. |
| 28 | No room for merchant fulfilled stock | Designed the location schema for merchant fulfilled and marketplace product. |
| 29 | Marketplace inventory untracked | Built an audit system: exported every listing and wrote each one to a unique SKU that could be used to find the product in its new shelf location. The SKU generator is still in use. |
| 30 | Pallets of old product sitting in the back | Built a flow for photographing product in a lightbox against a direct location scan, reporting to a database, for contract listers to turn into listings. Worked well, then went quiet. Our own organization and understanding of demand for that product wasn't there yet. |
| 31 | Parts catalog completely undefined | Wired up an organized part / type / category schema for every part the company purchased. |
| 32 | Parts department a physical mess | What lived in a corner of the warehouse was a pile of undefined, unlabeled parts. Handing a part to someone was effectively impossible. |
| 33 | Parts department, continued | Spearheaded the move to a centralized parts department: took every part down, opened every box, hired and trained people to audit them the way I needed, and built a rudimentary inventory system so they could adjust bin counts and assign locations. |
| 34 | Parts bins unreadable | Cut the front off a 52T cardboard box to make it front loading, with a 4x6 printed label on the face naming the part. A part in its location is now identifiable visually and digitally, and the bin labels are infinitely reproducible from the parts system. |
| 35 | Parts sorting | Spent a lot of time with my own hands emptying those boxes and sorting parts. Completely hands on. |
| 36 | No way to see the warehouse | Built a digital map of physical locations, so a user can find product by where it sits on a shelf, or be routed to a location. Now used in receiving. |
| 37 | Receiving label printers slow and locked down | Sourced thermal printers that weren't software locked. Became the standard for the whole warehouse. |
| 38 | Inventory software made purchasing difficult | Linked purchasing directly to inventory, so a purchase made intuitively in one place creates the order in the other. Removed the double entry and most of the cataloging mistakes at the same time. |
| 39 | Profitability calculations redundant | Instead of exporting purchases and matching each one to a listing and sale price to derive profitability, capture it at the moment of purchase and store it. A reactive measure became a permanent record. |
| 40 | Purchasing untracked and disorganized | Purchasing decisions weren't recorded anywhere. The warehouse was permanently reactive. The pipeline effectively began when a receiver opened a box. |
| 41 | Purchasing and warehouse barely communicating | Built the purchasing tool as the bridge between them. |
| 42 | Spreadsheet not capturing enough | Same function as the old sheet (how much should this be bought for, and was it profitable), except every purchase becomes a record carrying the profitability calculated at the time. |
| 43 | Marketplace purchasing too slow | Integrated a direct connection, so you can search, instantly see whether a unit is profitable without running the calculator, and check out into a purchase order. |
| 44 | Purchases missing parts and labor | Built a parts and labor pricing map so purchases automatically import their estimated parts cost into the profit calculation. |
| 45 | Vendor purchase orders messy to create | Added a copy and paste path: paste the rows from a vendor sheet and the purchase order builds itself with the right products. |
| 46 | Does the tool actually do the thinking? | Took someone from the cleaning department, sat her at a desk with me, and had her purchase product, then measured how efficient and profitable she was. |
| 47 | No purchasing projections | Used permanent purchase records plus per listing sales volume to project what sales should be, based on what was actually bought, month over month. |
| 48 | Projections not accurate | Time in house and fulfillment method skewed everything, so I mapped variables like buy box rate and in house production per vendor to tighten them. |
| 49 | Slow moving inventory unflagged | Flagged a category holding a lot of value and moving slowly, and outlined the margin we'd sacrifice to keep it moving. Raised the question in the right places. |
| 50 | Time in house impossible to calculate | The metric that couldn't be produced. This is what pushed the whole internal production system into motion. |
| 51 | Purchasing performance stored but not shown | Built daily and weekly purchasing performance reports, so management could see what was bought, what it should earn, and how purchasers spent their hours. |
| 52 | Inventory software lacked warehouse control | It taught us what good structure looks like, but couldn't cover the specific things our floor did. The production system went into full force. |
| 53 | Marketplace return rate unknown | Ran a full export, about a week of work, and broke it down to a clear 10%. |
| 54 | Repricer insights invisible | Wired the insights straight to management inboxes. |
| 55 | No instant view of inventory in house | The production system. |
| 56 | Poor visibility into in house product | Custom labels showing vendor, last touched, and stage. |
| 57 | Only receiving could print labels | Installed label printers at every station, so every user's adjustment to a product prints a new label describing its new state. |
| 58 | Shipping opening boxes to verify contents | Built staging: product comes off cleaners' outbound shelves and is scanned to carts. Because every attribute is assigned by the time cleaning finishes, and staging rules govern what can share a cart (no mixing conditions, no mixing product classes), shipping can trust the cart instead of checking it. |
| 59 | Label printing position | Eliminated. One person used to print labels for the whole cleaning department; now every station prints its own. |
| 60 | Specialty product positions | Eliminated. Lenses, cameras and special edition controllers used to require specific people. The software walks anyone through the category specific selections. |
| 61 | No reliable way to receive parts | Built parts receiving: locate the incoming order, take parts in from the box straight to locations. |
| 62 | No routing for marketplace product | Product used to sit until someone decided it should be listed elsewhere. Users can now route it themselves: if a unit doesn't fit the kitting catalog, it gets liquidated by definition. |
| 63 | No routing for incomplete product | Built a flow for selecting which parts a unit is missing. It counts toward partially processed goods and becomes a parts work order in the dashboard automatically, replacing the manual logging and write ups. |
| 64 | No audit ability | Counting inventory used to mean telling everyone to stop and count everything. Every user has a scanner, so every user can audit their own area. |
| 65 | No cross department production metrics | An email report covering each department's production, its incoming work, and where the bottlenecks are likely to be. |
| 66 | Condition grading a gray area | Selecting the higher condition grades now forces a photo upload, so a manager can review through the day and check that product is graded honestly. |
| 67 | Shipping opening every box to verify condition | Added the same photo to shipping's view, so they click and review the image instead of opening the box. |